
When Will We Really Know if Moderna’s Vaccine Works?

Moderna today released a long document detailing the protocol for its COVID-19 vaccine trial. Although there has been much speculation that the results of that trial would be available relatively soon, leading to an early authorization to use the vaccine, this release appears to douse that expectation. According to a New York Times article summarizing the information in the document, the soonest they expect to analyze the vaccine’s efficacy is in late December.
But a detailed analysis of the trial’s protocol gives reason to believe the first interim analysis will be much sooner, perhaps as early as mid-October. The protocol is specific that the first analysis will be done when they reach a total of 53 postive cases of COVID-19 combined between the test group and the control group. The late December target is merely a guess as to when they’ll reach that number.
Here are the factors that will determine how quickly they actually hit 53 cases:
• How fast they sign up volunteers. Their goal is 30,000. The plan was to add those volunteers equally over 13 weeks. So far they seem to be ahead of schedule, as they are about ten weeks in, but have already had 25,000 people begin the trial.
• How well the vaccine works. The better it works, the longer it will take to get to 53 cases, as most cases of COVID-19 will have to come from the control group. Of course, that would make it more likely that the results are statistically significant, so would increase the odds that the first analysis is sufficient for authorizing the vaccine’s use.
• How many people in the control group test positive for COVID-19. This is where the Moderna document is ultra-conservative. It assumes that, over a six month period, 0.75% of the study participants in the control group will get COVID-19. That breaks down to 29 people per 100,000 per week. However, in the seven days ending September 16, approximately 82 people per 100,000 tested positive in the U.S. That’s in the general population. There is good reason to expect that the people in the Moderna study will be more likely to test positive, for two reasons: one, Moderna has focused its study in areas with high rates of incidence, and two, people in the study are closely monitored and frequently tested, so there should be a lower proportion of undiagnosed cases than there are in the general population.
Can we estimate when they’ll actually hit 53 cases? Per the assumptions in the model, it will occur around the last week of December. If participants test positive at the current rate of Americans in general, they’ll hit that target by mid to late November. If they’ve done a good job enrolling high-risk candidates and after accounting for the use of consistent testing, I expect they’ll be ready to do the initial analysis in the middle of October.
If The Vaccine Is Analyzed So Soon, Will We Know if it Works?
Suppose that, of the 53 people in the study with positive tests, 38 are from the control group and 15 are from the vaccine group. That result would be consistent with Moderna’s goal of 60% efficacy. And it would be statistically significant, in the sense that, it would be certain that the vaccine had some level of efficacy, though perhaps less than 60%. The numbers would still be too small to rule out chance in making the vaccine appear more effective than it really is.
According to the protocol document, they will “declare victory” at the point the numbers demonstrate a 95% level of confidence that the vaccine is no less than 30% effective. If they hold to that standard, it could force them to wait for the second initial analysis, likely to be a month or so later.
It’s not hard to imagine this target being softened. After all, there is nothing magic about it. If the vaccine appears to be 60% effective, and there are no documented safety concerns, and if we’re 99% sure it’s at least somewhat effective, is there a good reason to continue to wait? I think the pressure to authorize its use will be quite strong at that point, and those pushing for it will have a pretty compelling case.
Does Trump Really have a 30% Chance of Winning?

Over the past few election cycles, the 538 blog has developed a reputation as the premiere election forecasting website. Like nearly every forecaster, they got the 2016 outcome wrong, but they did give Trump about a 3 in 10 chance of winning going into election day, higher odds than nearly everyone else gave him.
This year, their updated model again, as of Sep 9, gives Trump a 27% chance of winning in the electoral college. This is true even though Biden maintains a 7.6% lead in their weighted polling average.
How is it possible that Trump would retain such a realistic chance of retaining the Presidency even at such a significant deficit in the polls?
To answer this question, I dug into the weeds of the 538 model’s methodology. Before getting into the details, let me give you the headline: the primary reason that Trump’s chances appear significant is the possibility for changes in the polls between now and election day. (As opposed to either major polling error or his winning the electoral college despite heavily losing the popular vote.)
If the polls remained as they are today on Nov 3, the model would probably give Biden about a 90% chance of winning.
The gap between 73% and 90% can be explained by a number of factors, some of which, in my opinion, are overstated in the 538 model.
How Their Model Works
The 538 model is built on a state by state basis. If you compare the current polling average to the forecast, you can see that, in six out of seven key swing states, the forecast anticipates Biden’s lead to shrink. Here’s a look at the differences in the seven states most likely to tip the election:
Florida. Biden leads by 2.8, but is forecast to win by 2.0
Wisconsin. Biden leads by 7.0, but is forecast to win by 5.8
Arizona. Biden leads by 5.1, but is forecast to win by 3.2
Michigan. Biden leads by 7.4, but is forecast to win by 7.7
Pennsylvania. Biden leads by 5.0, but is forecast to win by 4.3
North Carolina. Biden leads by 1.7, but is forecast to win by 0.8
Minnesota. Biden leads by 6.1, but is forecast to win by 5.7
There are a few factors built into their model which cause the forecast to predict a narrowing of the margin. I’ll evaluate them one by one.
Historical partisanship. The model gives a weighting to how a state voted in 2016 (as well as a smaller weighting to how it voted in 2012). Since all the above states except for Minnesota voted for Trump in 2016, the model assumes that the opinion in that state will, to some extent, revert to its historical norm. This would seem like a legitimate reason to expect these states to tighten, except that it doesn’t factor in the more recent data from the 2018 mid-term election. For example, while Pennsylvania voted for Trump in 2016, in 2018, Democrats beat Republicans 55%-45% in total House of Representatives votes.
Incumbency advantage. There is an incumbency bonus baked in for Trump. This is apparently based on the record of incumbents winning more often than they lose: 14 of 19 since 1900. But the data on incumbents with approval ratings where Trump has consistently hovered (41-44%) tells a totally different story. Only Harry Truman in 1948 was re-elected with an approval rating as low as Trump’s. It seems to me that Trump’s incumbency is a disadvantage for him, compared with 2016, when people could not be sure what type of president he would be.
Economic Fundamentals. The economic fundamentals incorporated into the 538 model include six equally weighted variables. Three are pretty strong: income, inflation, and the stock market. Three are pretty weak: jobs, spending, and manufacturing. As a result, the economic fundamentals are seen as neutral. Neutral fundamentals tug the forecast to the center, reducing Biden’s expected performance. Given the unprecedented nature of this year’s economy, all historical analysis of the effect of economic fundamentals on voting seems of little value. I think people will see in the economy what they want to see: Trump partisans will remember a pre-Covid economy and focus on our returning to normal. Biden partisans will point to widespread continuing unemployment. The idea that people who currently oppose Trump will switch to supporting him over the next two months because of strong economic fundamentals is pretty farfetched. I can’t see this as a reason to expect the race will tighten.
Uncertainty. The model attempts to assess the level of uncertainty in the race. The theory is that higher uncertainty implies greater likelihood of shifting polls over the next two months. To measure uncertainty, it computes a number of factors:
- The number of undecided voters
- Sum of undecided voters and 3rd party voters
- Polarization of votes in the U.S. House of Representatives
- Volatility of the polling average
- Amount of national polling
- Size of the gap between the polling forecast and the fundamentals forecast
- Economic volatility
- Amount of big news (measured by headline size in the New York Times)
The first five points all point to very low uncertainty. The final two point to very high uncertainty. As a result, the model considers uncertainty to be roughly average compared to prior elections.
Here is where I find the biggest flaw in the 538 model’s methodology. Economic volatility and substantial big news do not need to be considered separately, as they should already be “baked in” to the calculation through their impact on the polling average. We would expect high economic volatility and major news events to swing the polls.
Moreover, this calculation assumes a continuation of prior trends, which is not necessarily a given. In fact, a good case could be made that after a period of unprecedented economic volatility, the next two months will likely show less volatility than the previous six.
In any case, the fact that polling averages have been very stable, even in the face of unprecedented economic volatility and boatloads of big news, suggests that people have made up their minds and are unlikely to change them. If the enormous swings in GDP and employment and the fluctuations in COVID-19 cases and the unrest related to Black Lives Matter protests have barely moved the polling averages, what could move them?
Given that each of the various components of the 538 model which suggest the race will tighten appear to be overstated, Trump’s odds of winning are probably a fair amount less than 3 out of 10.
Biden Has Major Election Edge According to Voter Group Analysis
Most polls have consistently shown Joe Biden with a lead ranging from 6-9% over the past few months. As of August 31, the Real Clear Politics Poll Average has Biden up by 6.9% and the 538 Polling Polling Average has Biden up 8.0%. But after Donald Trump’s surprise victory in 2016, there is widespread skepticism about the accuracy of polling. Many people seem to believe that the polls underestimate Trump’s support.
Most pollsters weight their polls according to demographic factors, trying to match their sample to the expected makeup of the electorate in categories such as age, gender, education level, income, urbanicity, etc. This is necessary because the actual respondents to a poll don’t always match the expected makeup of the electorate in these factors, and we know demographics have some predictive value. But one source of polling error is the inability to perfectly forecast the actual demographic breakdowns of the upcoming election. When the pollsters’ conventional wisdom proves wrong, wide scale correlated polling errors can occur.
That’s why I was excited to see a recent poll put out by the USC Dornsife Center for Economic and Social Research. On top of all the general demographic data, this poll asked people if they’d voted in 2016 and who they voted for. This extra layer of information makes it possible to break down the electorate into Voter Groups. And analyzing these voter groups makes predicting the outcome in November much more reliable.
First, let’s take a look at who the Voter Groups are:
By far he largest group of voters is what I’ll call Partisans. These are people who voted in 2016 and plan to vote for the same party’s candidate in 2020. This group will likely include around 70% of voters in 2020.
The next largest group will almost certainly be New Voters. These are people who didn’t vote in 2016. Last election about 15% of the voters were new. Given strong interest in the election, this year could be even higher.
The next three groups are all pretty small. The Switchers are people who voted for a Democrat last time and plan to vote for a Republican this time, or vice versa. The USC poll indicates that we should not expect more than 5% of the votes in this election to come from Switchers.
The Protesters are what I call people who are so unhappy with both major party candidates they vote for a third party candidate. In 2016, third party candidates scored 5.7% of the vote. This year looks to be similar.
The Former Protesters are people who voted for a third party candidate last time around but this time will vote for either Biden or Trump. That will probably be the last 3-4% of voters.
The beauty of grouping the electorate in this way is the ability to make forecasts on a group by group basis, building up to an overall forecast that ought to be far more reliable than a standard poll-based forecast.
The next step is to split each group between the two major candidates as well as third parties.
The Partisans. Joe Biden has small but significant advantage among partisans. Looking only at 2016 voters, 44.3% of them are Biden partisans and 40.6% of them are Trump partisans. Although this advantage is small, it looks to be very stable. People who voted Democratic in 2016 and say they intend to vote Democratic in 2020 are not likely, in today’s ultra-partisan atmosphere, to change their minds. The same goes for Republicans. It seems safe to say that there is not a whole lot of potential for a significant swing within this group, regardless of the news events between now and the election.
The New Voters. According to the USC poll, new voters favor Biden 52% to 32%. This lopsided advantage tracks with demographic factors. Most new voters are people who were not eligible to vote in the prior election. That group is made up of people between the ages of 18 and 22 and immigrants. Both of those groups vote heavily democratic. Some new voters will be people who could have voted in 2016 but chose not to. This group is less predictable. A heavy republican turnout advantage would even this category out. But given that the republicans had a turnout advantage in 2016, stretching that advantage even further seems unlikely.
The Switchers. Because of the intense partisan divide in America today, there just aren’t very many switchers. So while winning this group is very valuable (you both add a vote for your side and subtract one from the other side), there’s not many votes to be had. Biden has about a 2-1 advantage among people who plan to switch. This is without question the most unstable portion of the race. Winning those intended switchers back gives Trump has best chance of closing the gap. But only 3.5% of Biden’s ultimate voters look like they’ll be switchers. If Trump could pull even among the switchers, he’d reduce Biden’s vote by 1% and increase his by 1%, gaining a net of 2% in the process.
The Protesters. This group doesn’t affect the race much. If they all decided to vote, and they all moved in one direction, they could swing the election, but there’s no reason to think that would happen. These are the people who are the most disenchanted with the state of the government and the country.
The Former Protesters. This group is similar to the New Voters, in that they didn’t vote for a major party candidate last time, although they were all eligible. Because they were eligible, they don’t have the same demographic factors that give Biden an advantage. Still, they claim to favor Biden by 58% to 42%.
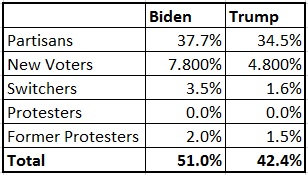
Totaling all these groups produces the following outcome:

Biden has a lead of 8.6%. This lead is generally consistent with the polling averages, and suggests that the polls may be more accurate this year than four years ago.
More significantly, it highlights the difficulty Trump will have closing the gap. Nearly 38% of the 51% of expected Biden voters are Partisans. Those people are the least likely to change their minds between now and election day. Biden also gets nearly 8% from New Voters, where his lead is quite lopsided. The demographics of that group make it very unlikely to shift. Therefore, Biden’s path to nearly 46% is quite clear.
The Switchers currently give Biden another 2% advantage. Although those people are probably the most likely to change their minds, Biden has a 68-32% advantage here. How much can Trump realistically hope to swing that?
This analysis shows that we have reached a point in the race where we can expect significant stability in the outcome and, most likely, the polling. It is hard to imagine anything happening between now and November 3 that will swing the race in a material way. If the gap between the candidates is 8.6% as of mid-August (when this poll was taken), it seems safe to forecast, with a high degree of confidence, that the gap will be between 7 and 10% on election day.
Distracted Driving – Not Good. Distracted Writing – Maybe Not So Bad

I came across an interesting article on Medium today by Angela Lashbrook, who said she’d purchased a $35 AlphaSmart in the hopes that this primitive device would help her finish the book she’d been intending to write. The AlphaSmart is essentially a word processor that does nothing other than allow her to type and edit. No internet connection, no email, no Google, no YouTube. Her theory was that, by eliminating all these distractions, she could force herself to concentrate on the task at hand when she sat down to write.
Her story quotes a couple of other writers who also use the AlphaSmart and claim it helps them concentrate. Her own results, after a week of writing, seem positive.
While I wish her the best in getting that book written, the article reminded me of a fascinating research paper that came out last year. Unfortunately for Angela, its conclusion makes me doubt how much impact the AlphaSmart – or the idea of cutting oneself off from all distractions – can have. The paper, “Yearning for Distraction: Evidence for a Trade-Off Between Media Multitasking and Mind Wandering” in the Canadian Journal of Experimental Psychology, found that when people had the chance to distract themselves by watching a video, they were less likely to let their mind drift aimlessly from their task. Using other media (videos, email, etc) is essentially a substitute for letting your mind drift.
It seems that some people have longer attention spans than others. If you’re someone with a naturally short attention span, at some point in the writing process, you’re going to need a break. So if you wall yourself into a room with no distractions, turn off the email, disconnect from social media, whatever, you’re probably going to find your mind wandering anyway.
It might make more sense to stop beating yourself up about getting distracted and build mental breaks right into your schedule. Your mind will thank you, and if self-acceptance is an important marker for perseverance, you might just give yourself the best chance of getting that book done after all.